Carbon, nutrients and microbes, in one technology.
At the core of every XEN product is the Regenerative Carbon Matrix: an activated long-chain carbon structure that feeds microbes, carries nutrients to the root zone and holds water, so carbon, nutrition and biology work as one system.
A biological carbon engine
Three interacting layers unlock, activate and retain.
Lignocellulose deconstruction
Specialised microbial consortia break down lignin, cellulose and hemicellulose, releasing carbon and nutrients that would otherwise stay locked in slowly decomposing biomass.
Complete nutrition + microbes
Decomposers, nutrient mobilisers, carbon-fixing bacteria and chemoautotrophs multiply, supported by 109 herbal extracts inspired by Vriksha Ayurveda.
Regenerative carbon matrix
A porous carbon matrix holds nutrients and water, gives microbes a habitat and exchanges nutrients with the root zone as the plant needs them.
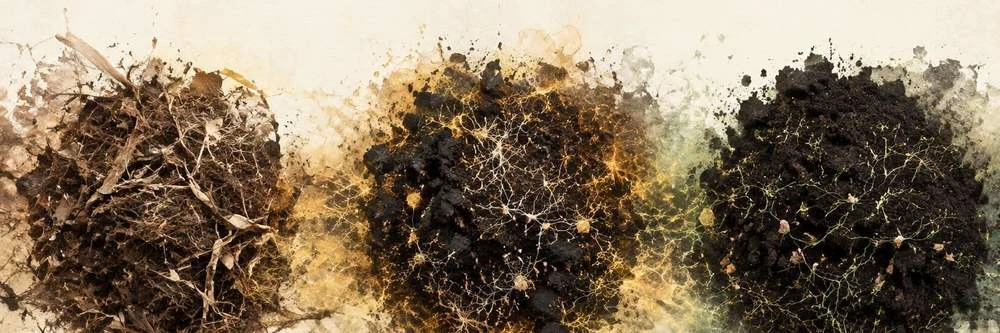
Three kinds of carbon
Carbon that is designed, not incidental.
Most organic inputs contain carbon. XEN designs it, integrating three carbon pools that each do a different job.
Feeds microbes now
Readily available energy that starts microbial activity immediately after application.
Holds water & nutrients
Humic and fulvic substances chelate nutrients and reduce their loss from the root zone.
Restores soil long-term
Durable carbon that builds soil organic matter, structure and water-holding capacity over seasons.
Inside the matrix
Activated long-chain carbon: the core of soil regeneration.
Stabilises organic carbon and raises soil organic carbon.
Cellulose, glucose and fructose feed every microbial strain so they thrive together instead of competing.
Humic and fulvic substances chelate nutrients and improve availability.
A porous home for a diverse, functional microbial consortium.
Bacteria bond with soil moisture to anchor carbon in the root zone and improve water holding.
Supports microbial respiration and speeds up nutrient transformation.
Chelates and carries macro and micronutrients to the root zone.
Better root growth, nutrient uptake and rhizosphere vitality.
Five engineering pillars
Science engineered. Nature enhanced. Value unlocked.
Carbon
Carbon stabilisation & nutrient retention
Activated long-chain carbon, higher carbon density, more soil organic matter, moisture retention.
Biological
Decomposition & nutrient cycling
Cellulose and lignin degraders, nitrogen fixers, phosphate and potassium solubilisers.
Biochemical
Humic, fulvic, amino acids, enzymes
Humic architecture, peptides, organic acids, natural enzymes, chelated nutrients.
Botanical
Functional botanical extracts
109 Vriksha Ayurveda extracts, phytonutrients and stress-resilience compounds.
Market
Quality, branding & channels
Standardised quality, buyback assurance, institutional partnerships, nationwide distribution.
Carbovardhak · lab-tested fertility stack
The numbers behind the matrix.
Microbial consortium
Functional groups that work together.
Anaerobic-to-aerobic adaptation. Microbes are acclimatised in a controlled hybrid environment so they survive and stay active in open soil.
Microbial coexistence technology. A carbon food matrix of cellulose, glucose and fructose prevents competition between strains.
| Functional group | Examples | Role |
|---|---|---|
| Cellulose degraders | Cellulolytic bacteria | Accelerate decomposition |
| Lignin degraders | Ligninolytic microbes | Break recalcitrant biomass |
| Nutrient mobilisers | PSB, KSB, KMB | Improve P & K availability |
| Nitrogen fixers | Azotobacter, Acetobacter | Biological N contribution |
| Biocontrol & roots | Trichoderma, Pseudomonas, Mycorrhiza | Plant resilience, root uptake |
Enrichment process
How Carbovardhak turns waste into wealth.
The same three biological stages, activate, multiply and stabilise, run at farm scale and at industrial scale. Choose a protocol.
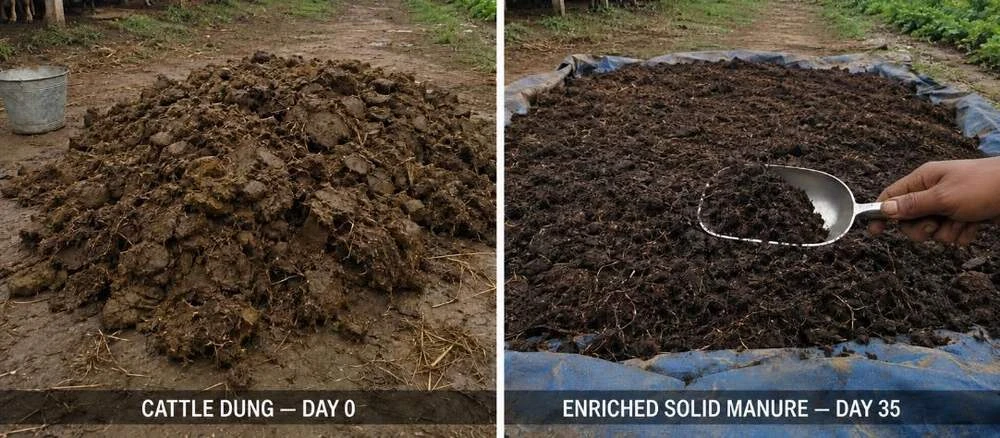
Dilute and mix the first half of the dose uniformly through the dung. Cover and rest. Decomposers start on the lignocellulose.
Turn and aerate the batch, apply the next quarter, remix and cover. Carbon-fixing and nutrient-mobilising microbes multiply.
Apply the final quarter, turn uniformly and verify readiness: brownish-black, about 40% moisture, no odour.
Roughly 1,000 kg/acre of enriched manure replaces about 3,000 kg of ordinary FOM, with 67% less handling.
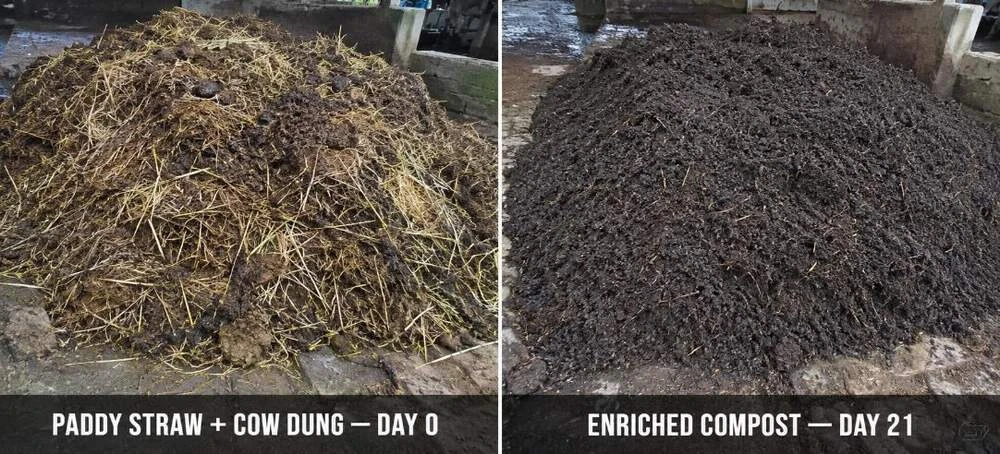
Typical dose: 50–100 L Carbovardhak per tonne of cattle dung (500 kg FOM + 35 L Carbovardhak + 35 L water → 570 kg enriched output). Paddy straw and dung compost runs 20–35 days with three turnings.
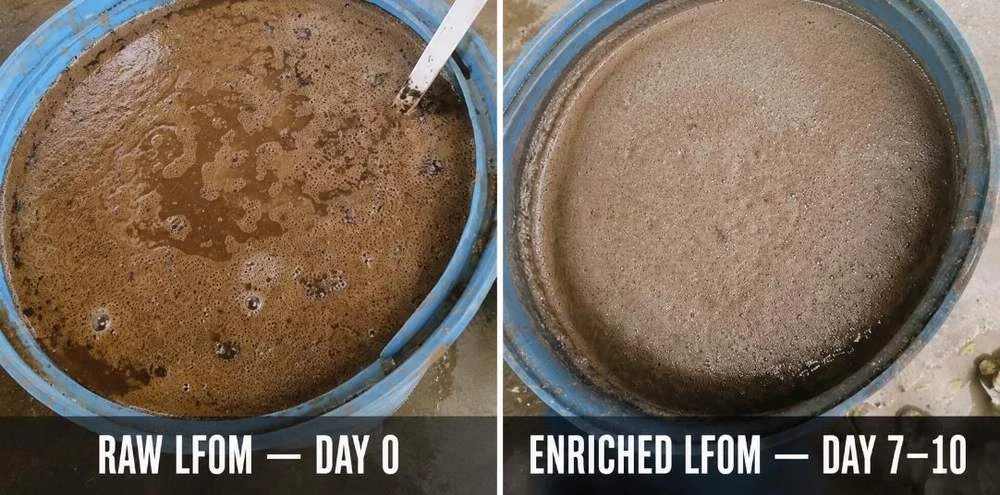
100 L Jivamrit or raw LFOM + 10 L Carbovardhak → 110 L enriched output.
Stir for about an hour a day for 7–10 days while microbes multiply.
Check odour, consistency and settling before use.
About 500 L/acre of enriched LFOM replaces roughly 1,500 L of untreated slurry, through drip, drench or irrigation channels.
Working range for liquid enrichment is 5–15%, subject to site validation.
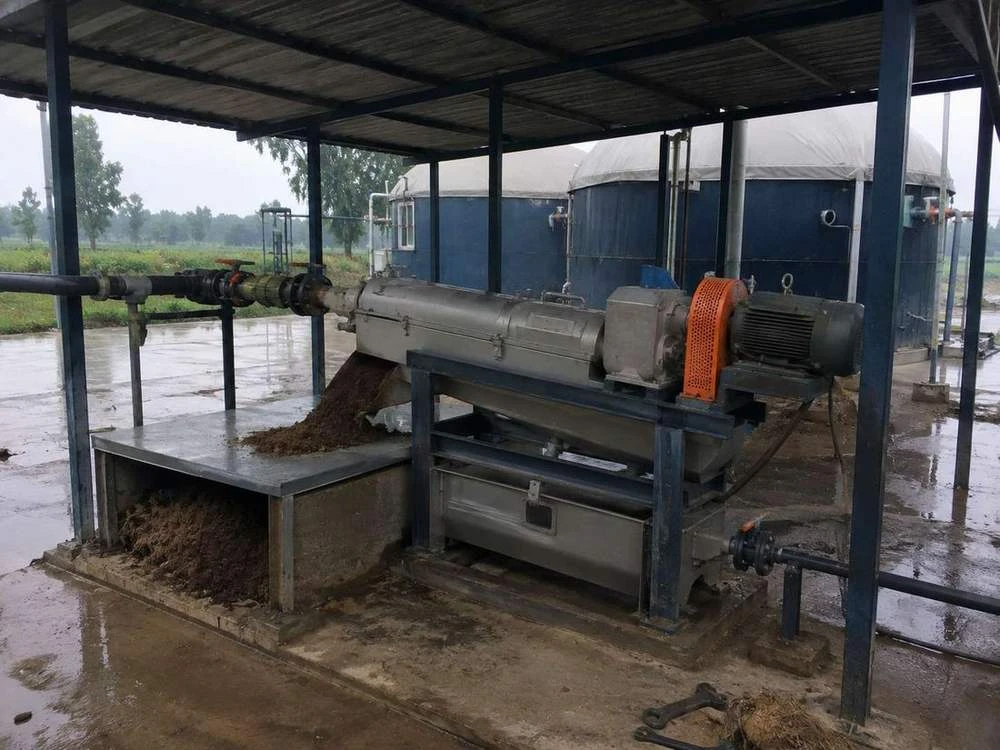
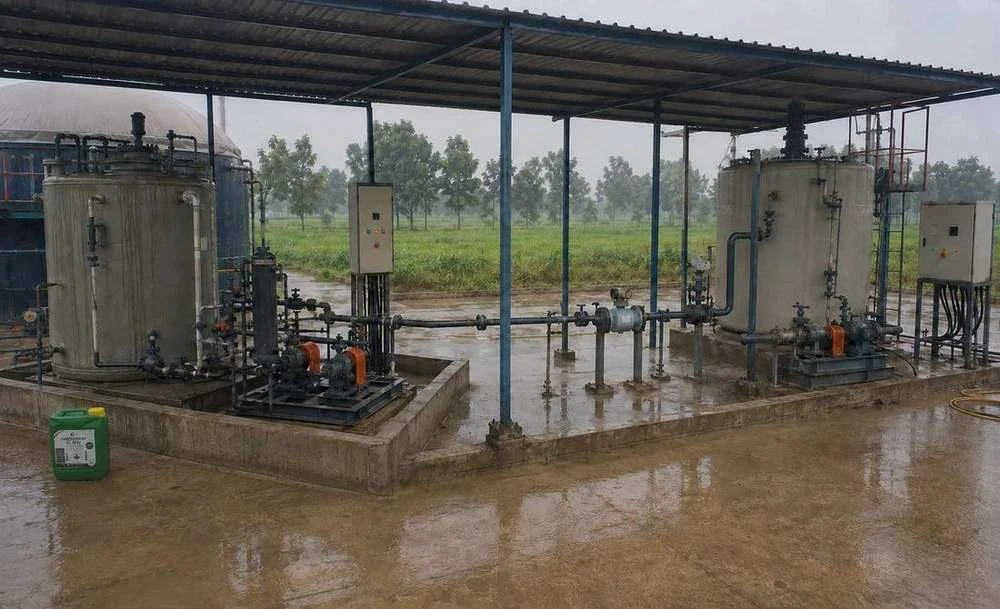
The PLC meters the batch and injects half the dose via pump → injection quill → static mixer → enrichment tank.
Interlocks verified, 25% injected, intensive mixing; programmed intermittent mixing between dose days.
Last quarter injected with intensive homogenisation. Tank stays closed and safely vented.
Final mixing, closed sampling and lab checks. Only approved batches are filtered, stored and dispatched.
Dose calculator
Total dose = LFOM batch × 10%
Calculated from the volume actually transferred into the enrichment tank, not digester feed or plant throughput. Confirm dose and residence time in a controlled pilot before sizing equipment.
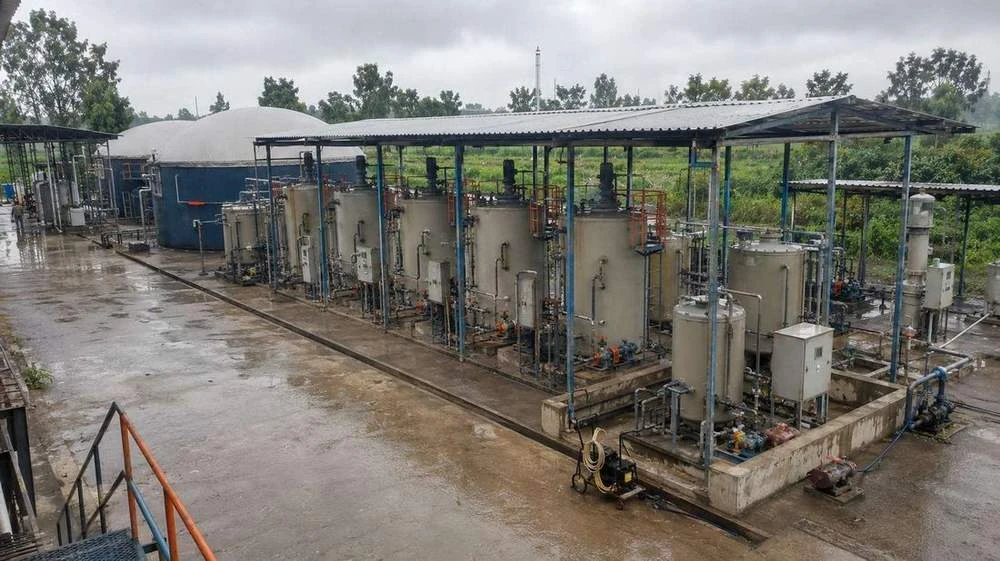
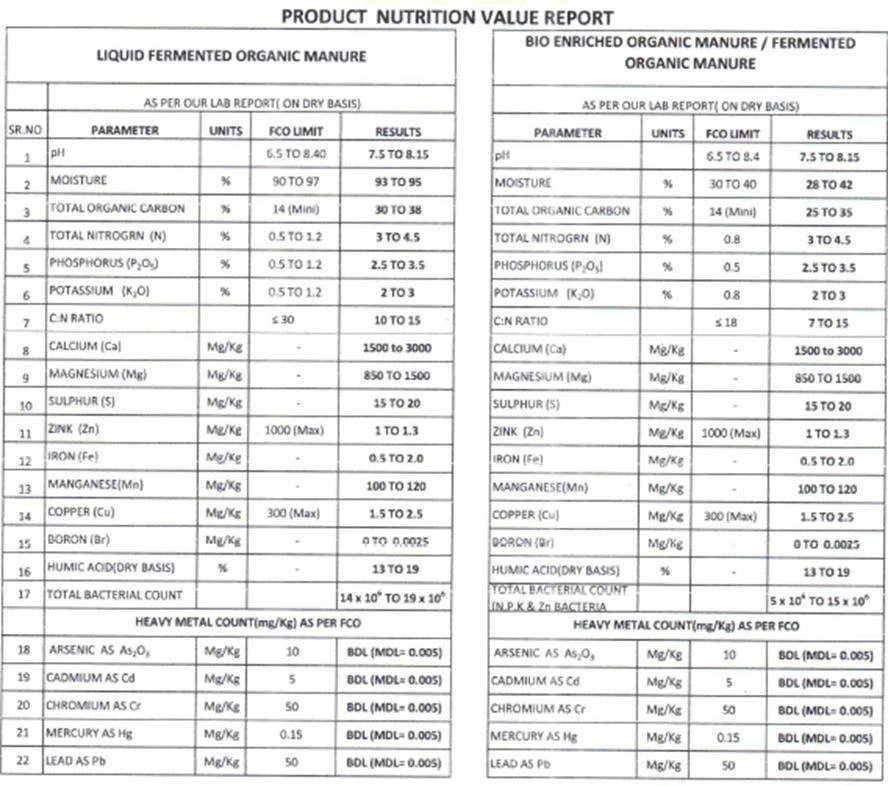
Lab-verified enriched manure
Far above FCO limits, same parameters, side by side.
| Parameter | Liquid FOM · FCO limit | XEN enriched liquid | Solid FOM · FCO limit | XEN enriched solid |
|---|---|---|---|---|
| Total organic carbon (%) | 14 min | 30–38 | 14 min | 25–35 |
| Total nitrogen (%) | 0.5–1.2 | 3.0–4.5 | 0.8 | 3.0–4.5 |
| Phosphorus, P₂O₅ (%) | 0.5–1.2 | 2.5–3.5 | 0.5 | 2.5–3.5 |
| Potassium, K₂O (%) | 0.5–1.2 | 2.0–3.0 | 0.8 | 2.0–3.0 |
| C:N ratio | ≤30 | 10–15 | ≤18 | 7–15 |
| pH | 6.5–8.4 | 7.5–8.15 | 6.5–8.4 | 7.5–8.15 |
| Humic acid, dry basis (%) | — | 13–19 | — | 13–19 |
| Heavy metals (As, Cd, Cr, Hg, Pb) | As 10 · Cd 5 · Cr 50 · Hg 0.15 · Pb 50 | Below detection | same | Below detection |
Source: Product Nutrition Value Report, dry-basis laboratory results. Micronutrients (Ca, Mg, S, Zn, Fe, Mn, Cu, B) also reported.
Carbon-Centric Digestate Valorisation Platform™
One CBG plant. Two value engines.
A CBG plant is both an energy facility and an organic-resource processing facility. Energy is recovered as gas; carbon and nutrients continue through the digestate. The second value chain begins after digestion, not after disposal.
A · Energy ledger
Biogas → CBG
gas volume × methane recovery × CBG realisation
Primary plant revenue. XEN does not touch this process.
B · Digestate ledger
FOM + LFOM → premium fertiliser
FOM/LFOM quantity × verified quality × market offtake
More than 90% of the biomass leaving a digester comes out as digestate. Today it is mostly sold as low-value bulk manure.
The 90% opportunity
Over 90% of digestate’s potential value is untapped.
Raw digestate has nutrients in low-available form, unstable carbon, inactive microbes, odour and pathogens, and gives farmers inconsistent results. Carbovardhak Flow activates that hidden potential and turns it into a new profit centre for the plant.
Digestate Engineering™ process
From residue to premium regenerative fertiliser.
Optional size reduction, moisture adjustment, homogenisation.
Biogas production runs unchanged.
Solid FOM and liquid LFOM separated.
Characterised: moisture, TS, pH, EC, carbon, NPK.
By volume for LFOM, by weight for FOM.
Uniform distribution of matrix, microbes and nutrients.
48 hours to 10 days (21-day cycle for industrial LFOM).
High-carbon, nutrient-rich, microbially alive and QC-released.
Quality-control framework
One batch. One auditable decision.
Incoming FOM / LFOM
During enrichment
Final enriched product
Every batch carries a Digital Batch Passport: batch number, date and shift, feedstock mix, digestate and Carbovardhak quantities, mixing and retention, operator log, sample ID, lab result and release status.
Retrofit · downstream by design
Biogas production stays exactly as it is.
- No addition to the digesterNo interference with digestion or methanogenesis.
- Starts after separationSeparate FOM and LFOM modules, matched to daily digestate output.
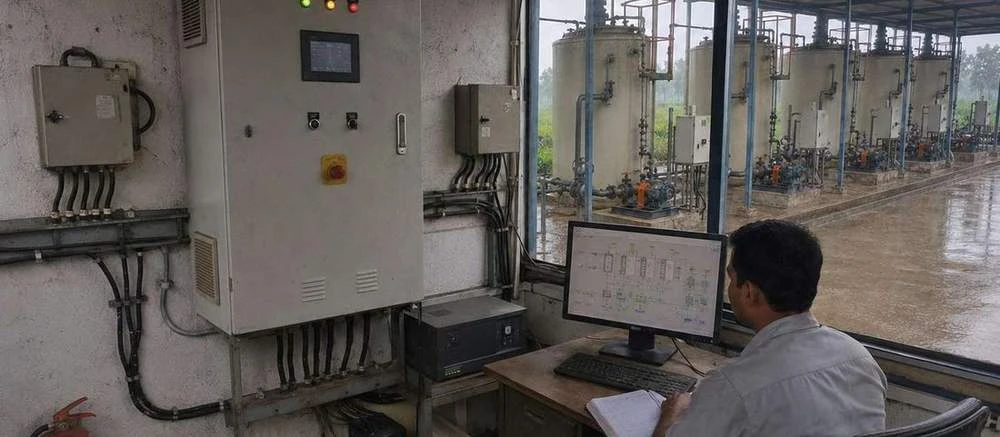
- Metered and recordedCovered processing, drainage control, SCADA/PLC integration where feasible.
- Phased rolloutPilot batch → validated SOP → modular retrofit → continuous operation.
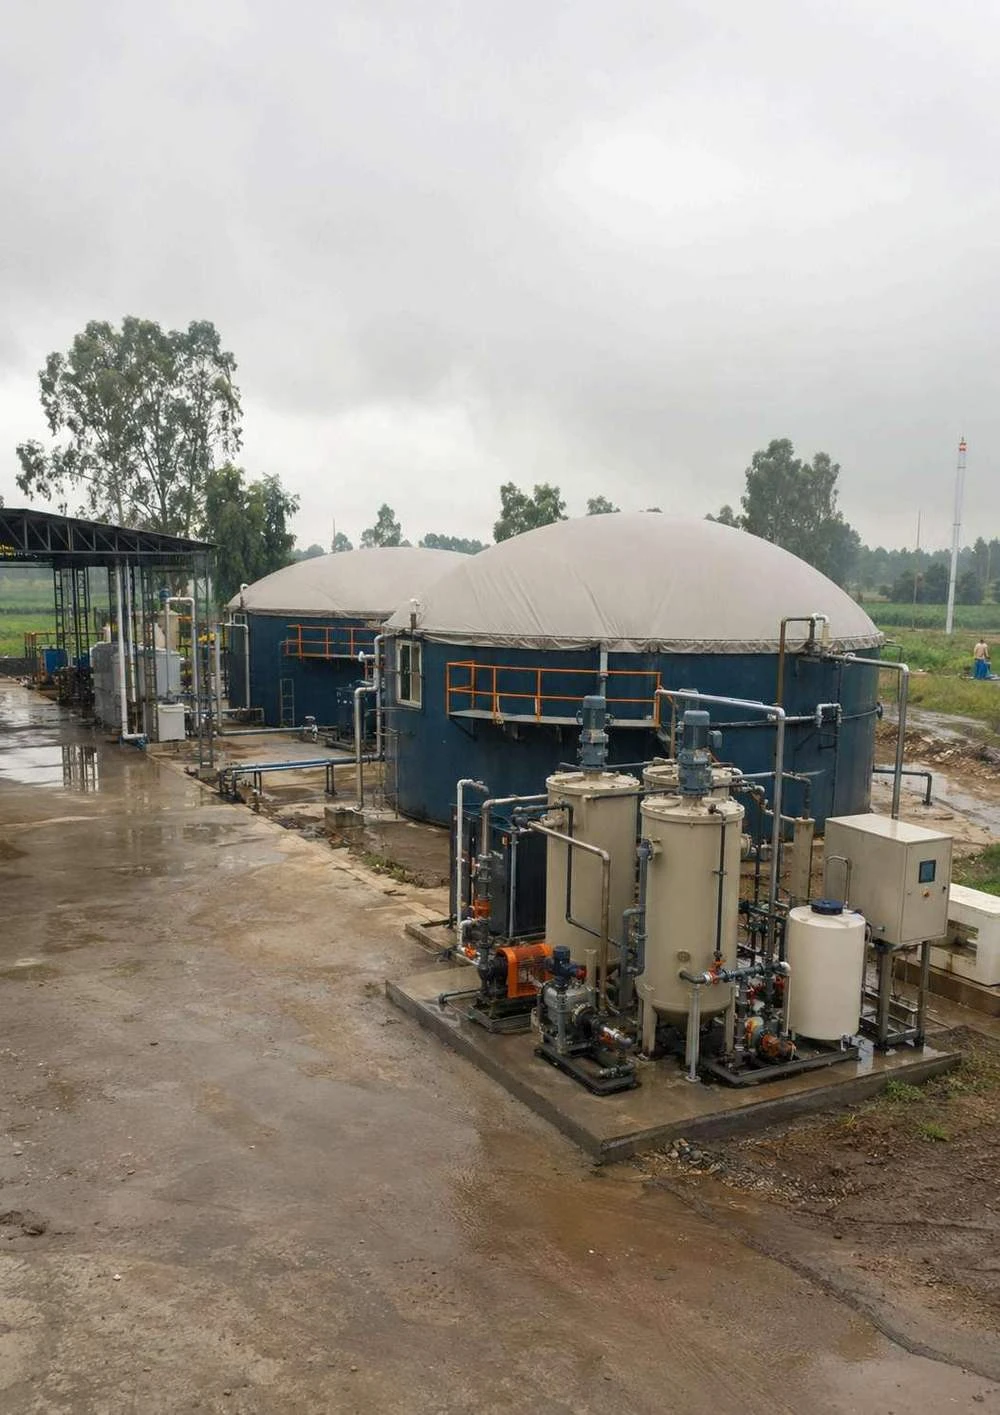
Four Revenue Engines™
From a single revenue stream to a multi-revenue enterprise.
CBG revenue
Continued core income from industries, city gas distribution and mobility.
Premium fertiliser
Enriched FOM and LFOM for agriculture, horticulture, landscaping and export.
Institutional markets
Bulk and contract supply to FPOs, corporates and government programmes.
Environmental services
Future carbon credits, ESG partnerships and ecosystem restoration.
Pilot phase 1
BaselineMap feedstock and digestate mass balance, characterise untreated FOM and LFOM.
Pilot phase 2
ProcessUntreated control vs Carbovardhak-treated batches; preliminary SOP.
Pilot phase 3
EvidenceControl-vs-treatment field plots, farmer and buyer feedback.
Pilot phase 4
ExpansionFreeze dosage and equipment, QC release system, offtake strategy, more plants.
Gaushala–FPC value chain
One local resource. Three rural beneficiaries.
Gaushalas become decentralised fertiliser-production centres, and FPCs become last-mile regenerative input centres for smallholder farmers.
Collect and segregate dung; supply space and trained operators.
31-day controlled cycle unlocks carbon, nutrients and biology.
Moisture, maturity, composition and batch traceability.
Procure, store, distribute and provide crop guidance.
Apply 500 kg/acre under crop-specific protocols.
Lower costs, higher crop revenue, healthier soils.
Gaushala · per tonne produced
₹2,275Benefit–cost 1.15Cost ₹14,725 · revenue ₹17,000. A recurring income from dung instead of a disposal burden.
FPC · per tonne distributed
₹3,000Benefit–cost 1.18Cost ₹17,000 · revenue ₹20,000. A new regenerative-input business vertical.
Farmer · per acre at 0.5 tonne
₹4,000 savedBenefit–cost 2.2–3.4₹10,000 vs ~₹14,000 conventional inputs, plus ₹8,000–20,000 extra crop revenue. 90% less manure to handle.
| Parameter | Existing enrichment practices | Carbovardhak-based enrichment |
|---|---|---|
| Approach | Composting, vermicomposting or one microbial consortium | Integrated biological carbon, nutrition and microbial enrichment |
| Decomposition | Natural, often slow and variable | Specialised consortia accelerate lignin, cellulose and hemicellulose breakdown |
| Microbes | Decomposers or selected N-fixers/PSB | Decomposers, nutrient mobilisers, carbon-fixing bacteria, chemoautotrophs |
| Carbon | Present but rarely designed | Labile, humic and stable carbon in a regenerative matrix |
| Herbal functionality | Usually absent | 109 herbal extracts inspired by Vriksha Ayurveda |
| Application | Several tonnes per acre | About 0.5–1 tonne per acre |
| Crop response | Gradual, needs supplementary inputs | Designed for measurable response from the first season |
| Standardisation | Varies by feedstock and location | Batch records, SOPs, readiness checks, lab testing |
Validation & quality
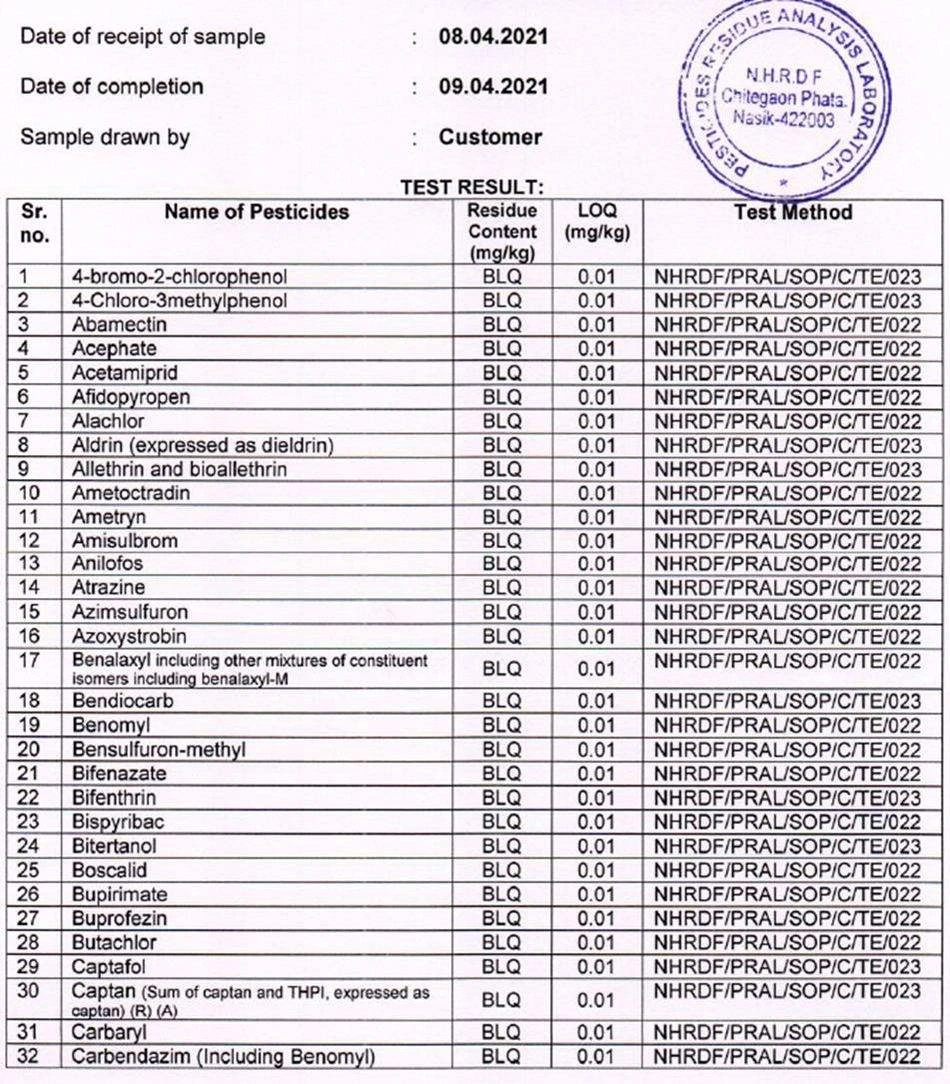
Certified. Registered. Independently validated.
Soil lab · 15 months
Krishna Sudha Academy & BAIF
Farmer soil report · 30 months
Sandip Patidar, Pune
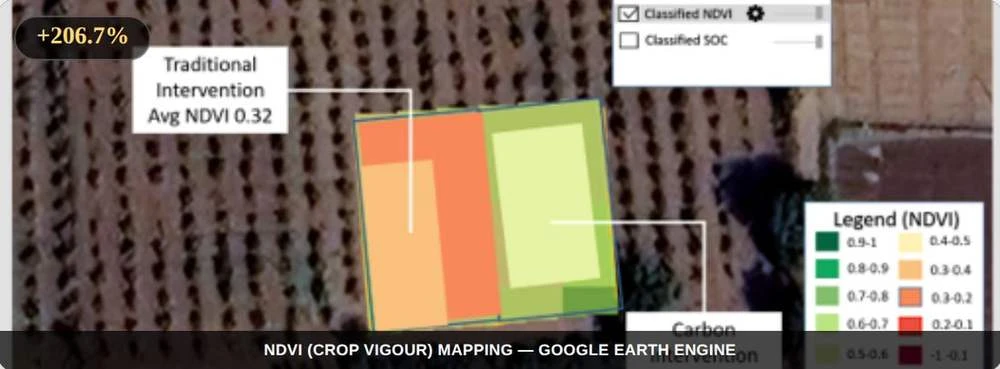
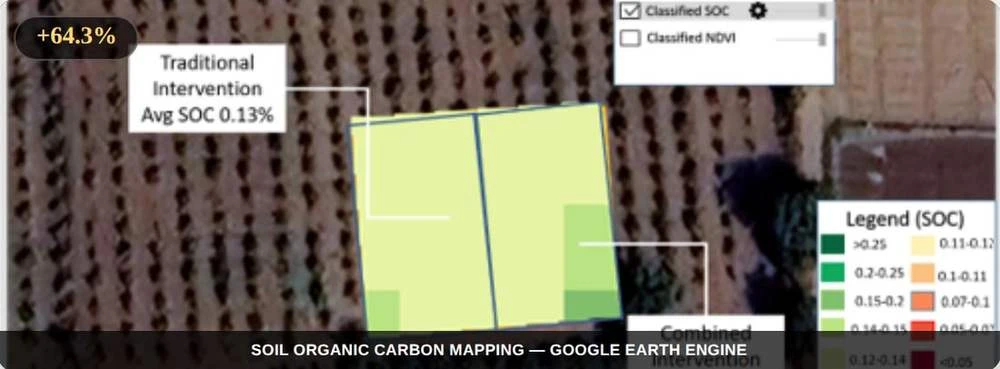
Satellite · Google Earth Engine
16 pomegranate farms with TechnoServe